Our Research
For CARD we wanted to create an App that doesn’t work as a usual meal planner. Instead of tracking you calorie intake, we try to give you insight on the CO2- and water-footprint of the meals you consume and help you towards a more sustainable diet. But, how does an environmentally friendly or sustainable diet look like in the first place? How much Water is needed to grow a kg of product, and how much CO2 is emitted for it to be farmed and end up on your plate?
Research Areas
A sustainable diet
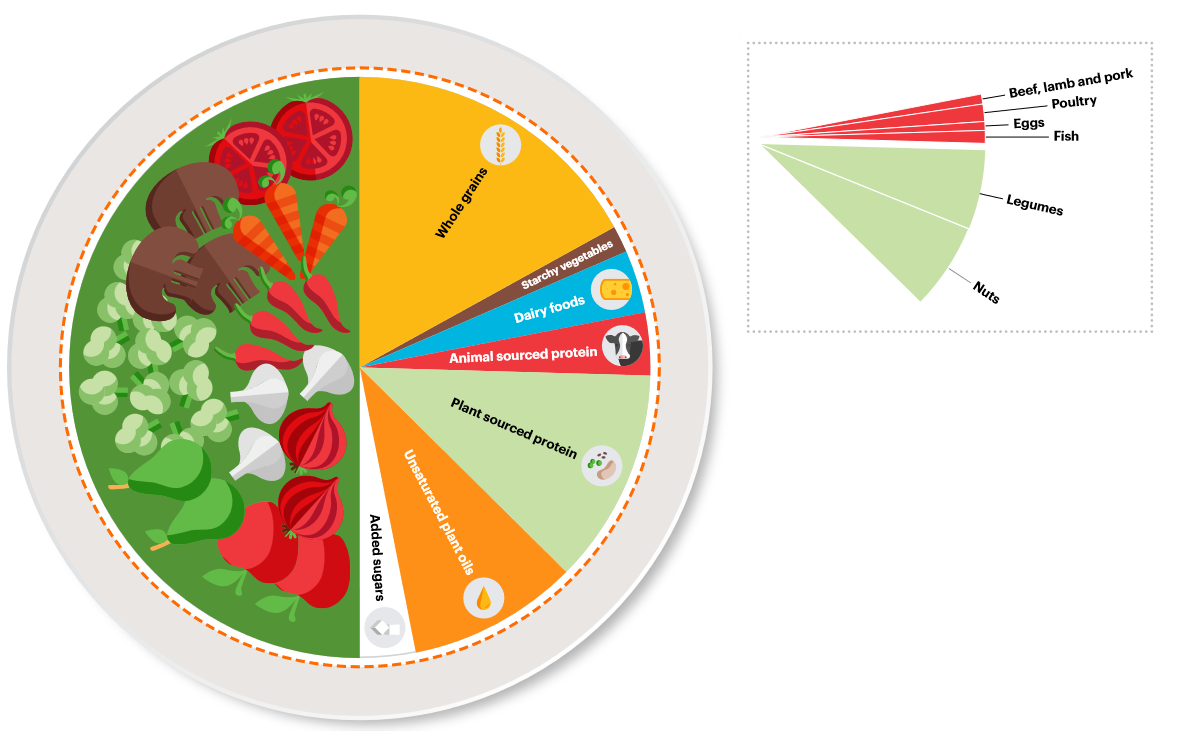
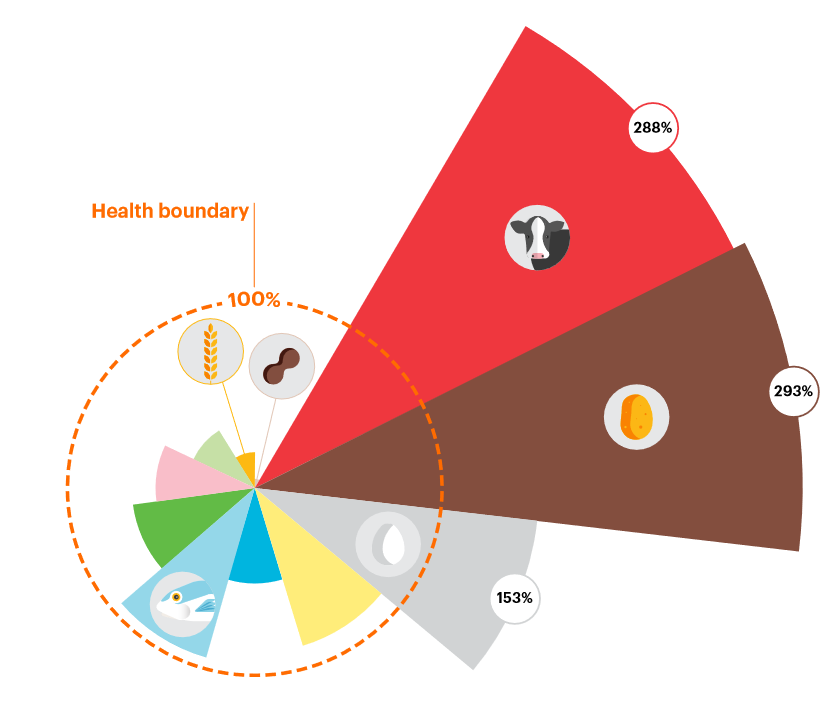
As a baseline for an environmentally friendly diet, we looked at the data provided by the EAT-Lancet Commission. They calculated, for an expected global population of 10 billion people in the year 2050, how all of them could be fed indefinitely, while maintaining our environment. While being more focused on environmental impacts, the EAT-Lancet Commission did not neglect the health aspects of one’s personal diet, and nutritional needs are met. The diet also doesn’t include any specific ingridients but works with broad food categories. Thus, it is easily globally adaptive. In the following graphs you can roughly see how the Eat-Lancet diet looks, und what the global average looks like compared to it.
CO2eq-Emissions
For the CO2eq footprint (eq standing for equivalent since other emissions like methane are also considered), it is a general fact that it is much more important what you eat, than where it is from. While the emissions of transportation can be significant,the overall CO2eq footprint includes a lot more factors like:
- land use
- farming methods
- processing
- retail
- packaging
- and waste management.
For animal basesd products the CO2eq-footprint of the feed has to be included as well. Thus, plant based products usually have a much better footprint then animal based products. When comparing foods of the same type, transportation becomes a more important factor. To decrease one’s personal footprint, one should try to buy unprocessed products that are grown regionally and have as little packaging as possible. Our CO2eq data stems mostly from a study from Reinhardt, Gärtner, and Wagner named “Environmental footprints of food products and dishes in Germany” from the year 2020.
Water consumption
Another important environmental impact our food systems have is the use of water. Water use can be split up into:
- green water (rainwater),
- blue water (surface and groundwater)
- and grey water (wastewater and pollution).
The effects of water use can be devastating for affected regions but vary strongly dependent on the farming methods and weather conditions. Effects can include:
- freshwater loss due to droughts,
- groundwater depletion,
- degradation due to fertilizers and pesticides etc.
The production of animal-based Products accounts for about one-third of our global water use, as they usually have way higher consumption rates than fruit and vegetables of the same nutritional value. To decrease one’s personal water footprint, one should buy unprocessed products with as little packaging as possible.
Our water data stems mostly from Mekonnen and Hoekstras studies “The green, blue and grey water footprint of crops and derived crop products” from 2011 and “A Global Assessment of the Water Footprint of Farm Animal Products” of 2012.
Last Remarks
The environmental impact of food production is a complicated topic, and a lot of educated guesses had to be made even in our source
material. Alot more research has to happen in order to fill our gaps of knowledge on this topic. Nevertheless it is clear that our food systems, and the way we produce and eat as a society have to change.
In the end numbers we provide you will only be a rough estimate of your personal footprints, but we still hope to give you a better picture of the small impact you can have.